Creating a blog with Hugo and hosting it in GitHub Pages is easy. I am not going to explain it because you have this wonderful post by @panicoenlabox , who explains it perfectly and it is the one that I followed.
It contains information about creating a site with Hugo, deploying it to GitHub pages via GitHub Actions and even setting your custom domain for the site. I would just highlight that I used a different template, in my case, Hugo Bootstrap Theme (you can see a real life example of this template here ).
Besides creating the blog, my goal was to connect it to Google Analytics in order to collect user information. I am really concerned about data security and data anonymization, but I do understand the value of knowing who visits your sites, from where are they connected, which pages receive visits or don’t and many other important KPIs.
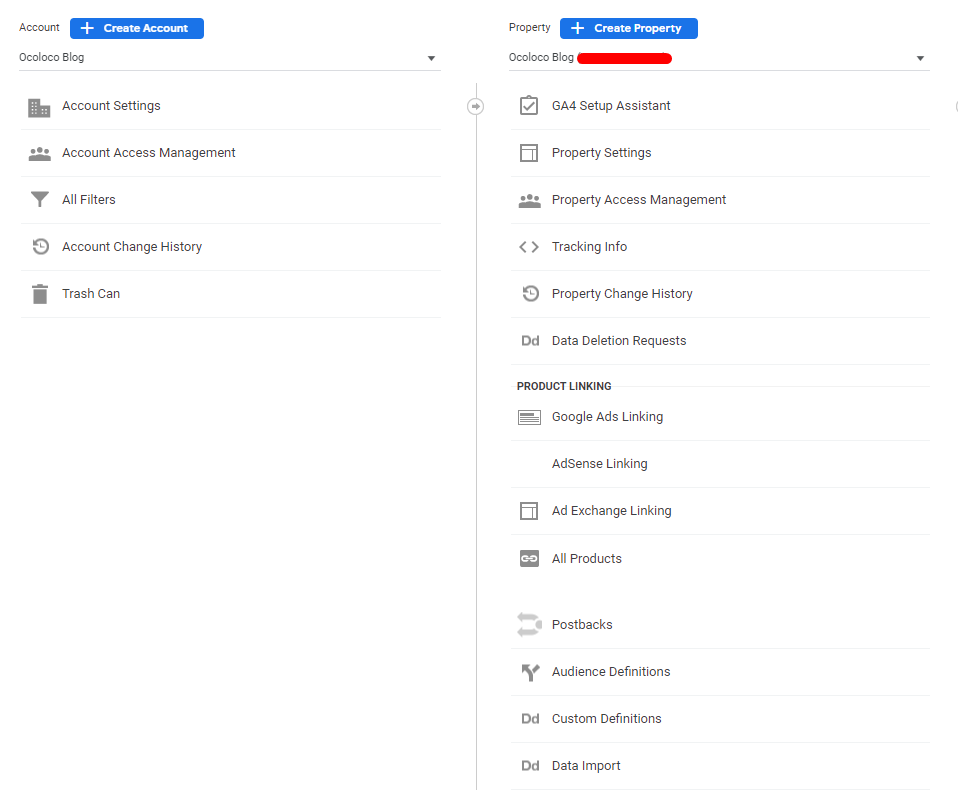
For connecting the blog with Google Analytics, I simply created an account in their site and set up a property.
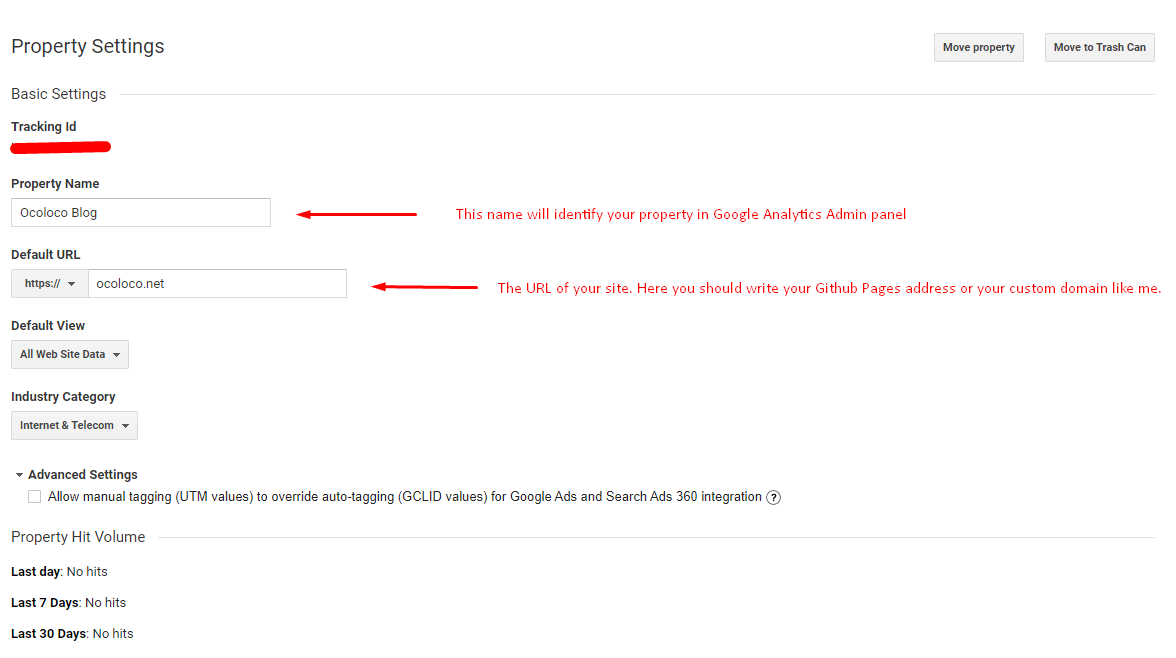
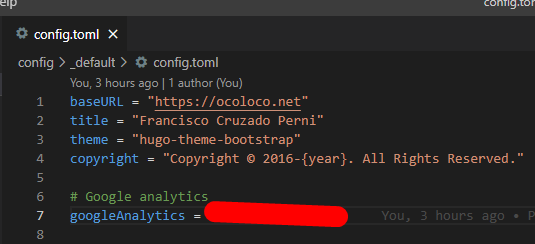
Copy the Tracking Id, as you will need it to set it in the config.toml of your Hugo Site.
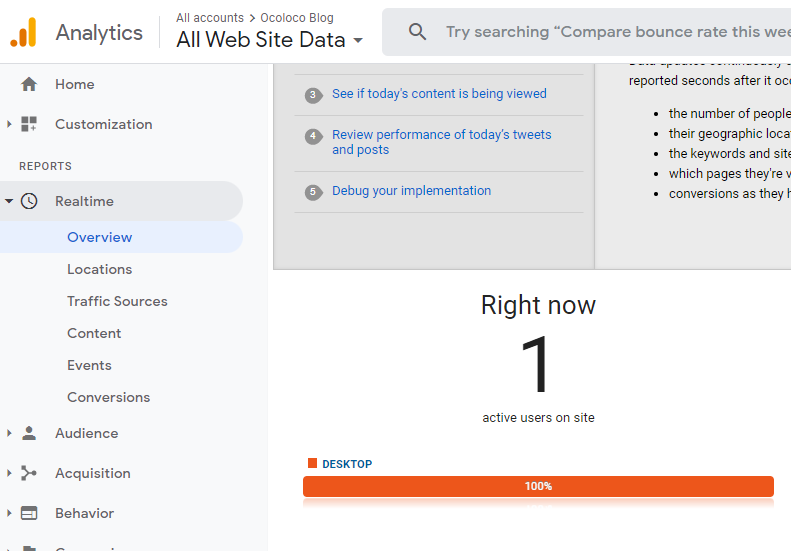
If everything works properly, you can go to the Real Time dashboard in Google Analytics and see one connection.
Google Analytics collects, analyzes and visually represents inside their web this information, but the ultimate goal was to extract the logs recorded in Google Analytics and instead of using the already provided visualizations by Google, create our owns with Tableau. In this example we will use Tableau Desktop.
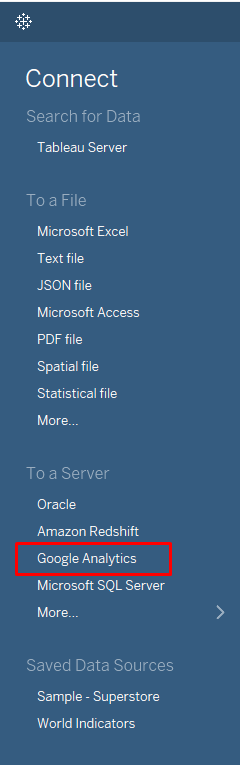
We open it and select the appropriate connection
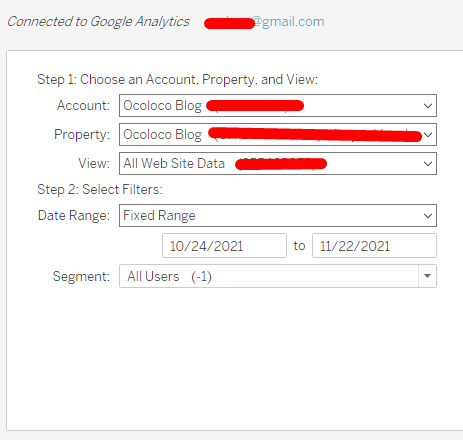
A browser tab will open and we need to select the Google account that we used for setting Google Analytics and give permissions to Tableau. After we have set up everything, we need to go back to Tableau Desktop.
In the Datasource tab, we will need to select the Google Analytics account, property and view (in case that we had more than one). Also, we need to select a Date Range.
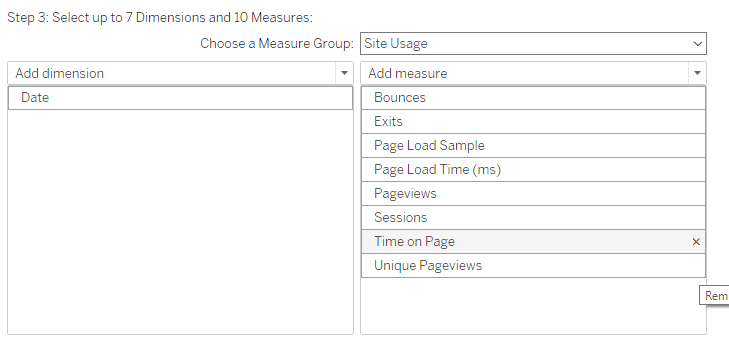
The final step will be to select Dimensions and Measures. There a severals pre-defined groups that will provide you with a collections of fields, which you con add, remove or combine with others. For a first contact, we can select the Site Usage group.
After following all these steps, is up to us to create our Visualizations, Dashboards and or Stories with Tableau to analyze properly our site data.
You can find the source code of this blog in this GitHub repository .